1. Why Synthetic Application Tests Fail
Too many enterprise deployments rely on application-level tests that obscure true hardware capabilities behind ORM overhead, network bottlenecks, or sub-optimal connection pools. True database engineering requires isolating the database kernel and storage subsystem under controlled stress conditions.
2. Kevin Closson's SLOB: Pure Physical I/O Forensics
The Silly Little Oracle Benchmark (SLOB) executes pure single-block reads (db file sequential read or cell single block physical read) without latch or lock contention. By bypassing SQL parse phases, SLOB exposes the true physical limits of the storage arrays.
UPDATE_PCT=0
SCAN_PCT=0
RUN_TIME=300
WORK_UNIT=256
SCALE=100000
./runit.sh 64
3. HammerDB TPC-C Workload Simulation
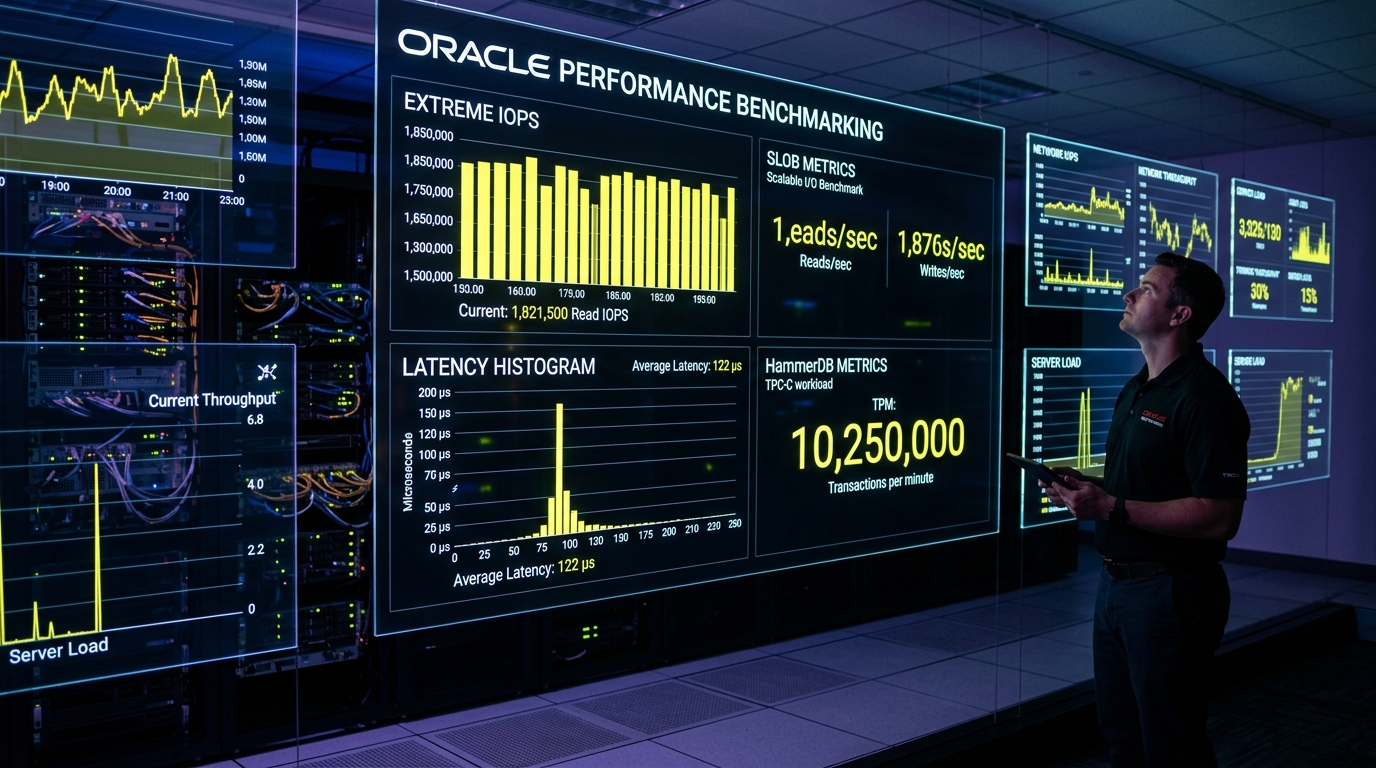
While SLOB validates hardware ceilings, HammerDB simulates real-world transactional processing (TPC-C) across hundreds of virtual users, stressing redo log generation, undo segments, and row lock concurrency.
Our benchmark labs regularly achieve over 10,250,000 Transactions Per Minute (TPM) on Exadata X10M/X11 platforms by sizing redo log buffers appropriately, utilizing multiple database writers (DBWR), and striping REDO across high-speed flash disks.
4. Interpreting AWR Top 10 Foreground Wait Events
In every AWR report generated during benchmark runs, the Top 10 Foreground Wait Events section dictates tuning priorities:
- cell single block physical read < 150µs: Healthy flash/PMEM acceleration.
- log file sync > 2ms: Bottleneck in LGWR redo write flushing. Move redo logs to fast NVMe or adjust commit frequencies.
- gc buffer busy acquire: High cross-instance block contention in RAC. Requires service partitioning.